GIS Item Usage Web App
15 Jul 2019 - | Author: Laurin
Every year at the Fairbanks North Star Borough our GIS team has to report how their resources are being utilized, particularly by the public, since that’s whom a local government is meant to serve.
They were able to pull some google analytics from our main website to see users were hitting the page, but they had no way of seeing internal FNSB use except for Esri’s ArcGIS Online, but then they would have to open each individual item to view that data.
That’s where I came in. I created a small Flask Python webapp, served internally, that had access to all the items on ArcGIS Online. Reports could be created and saved with all the desired graphs to re-utilize year after year.
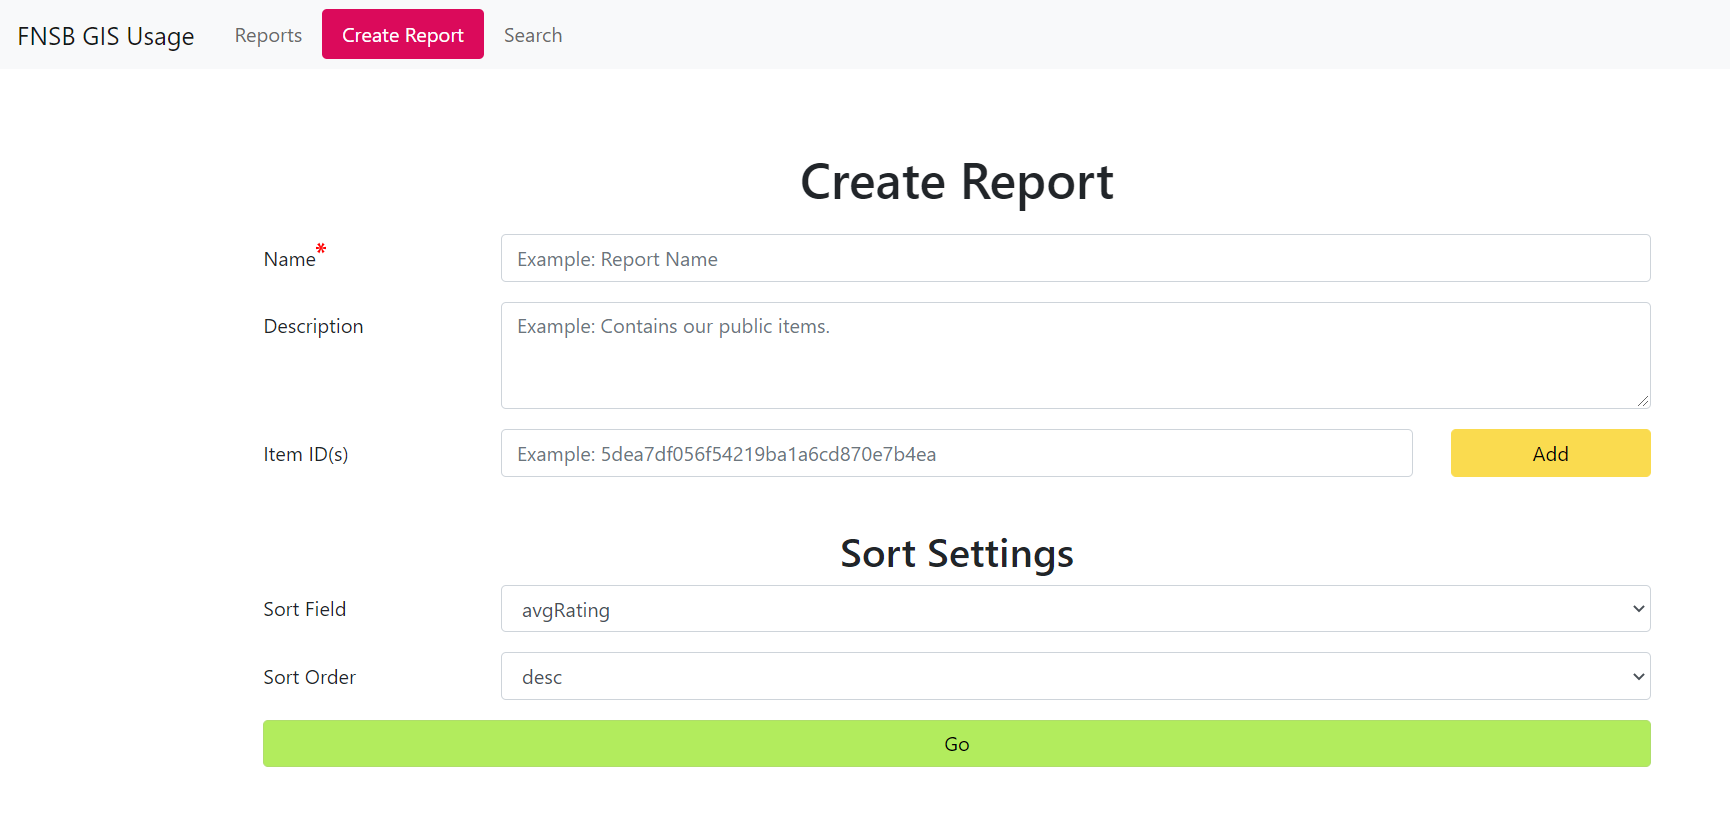
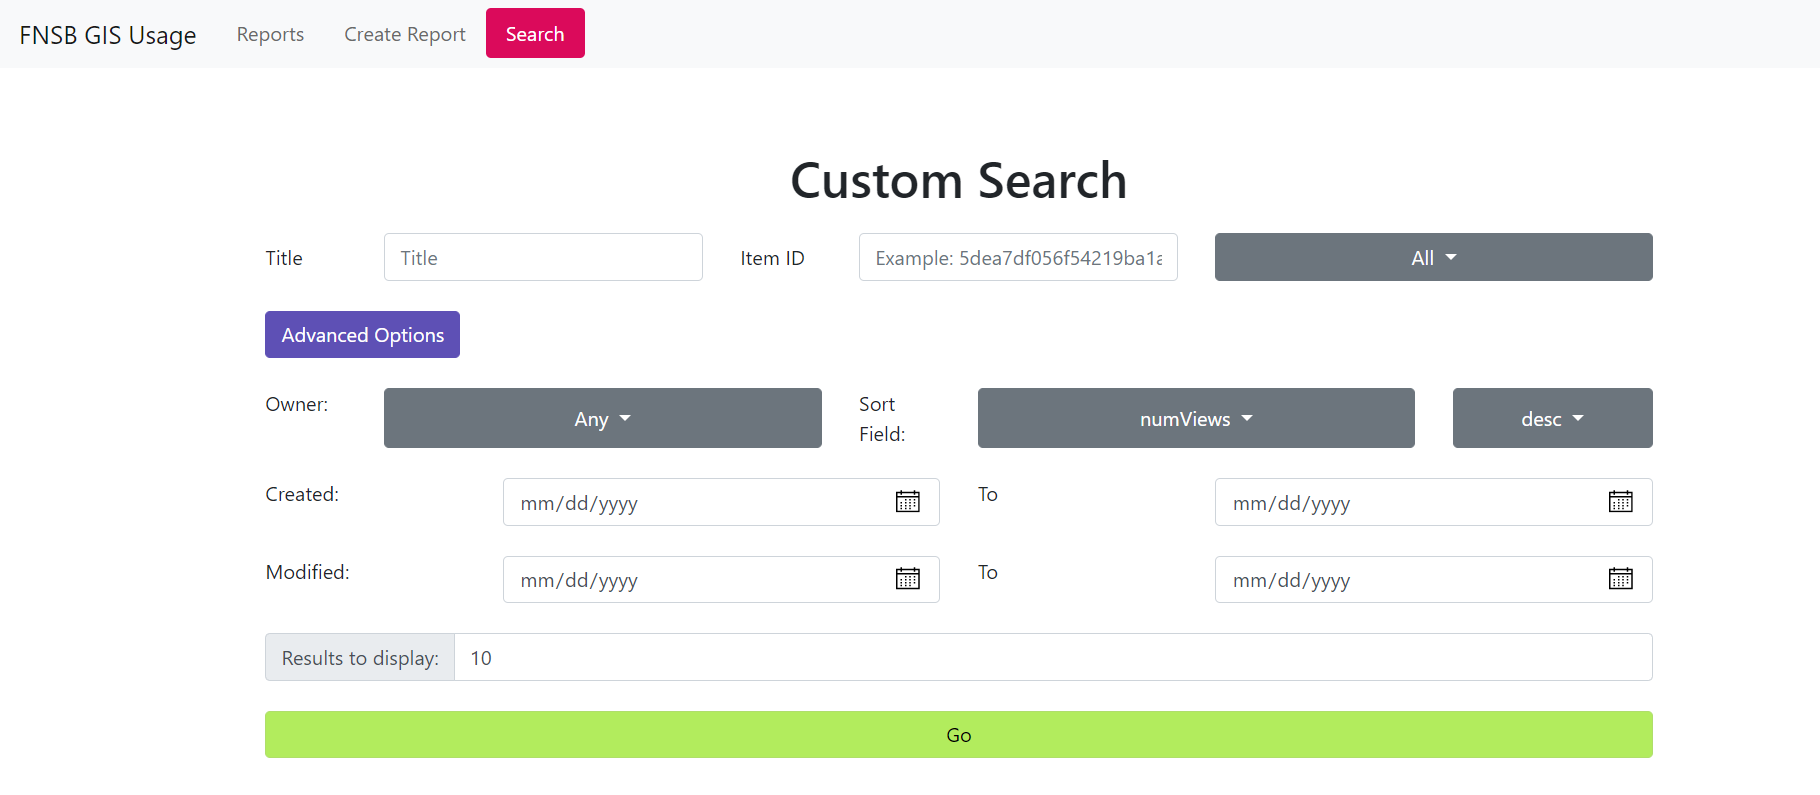
It also had a search function to make it easy to choose which graphs to save or if you wanted to see something specific.
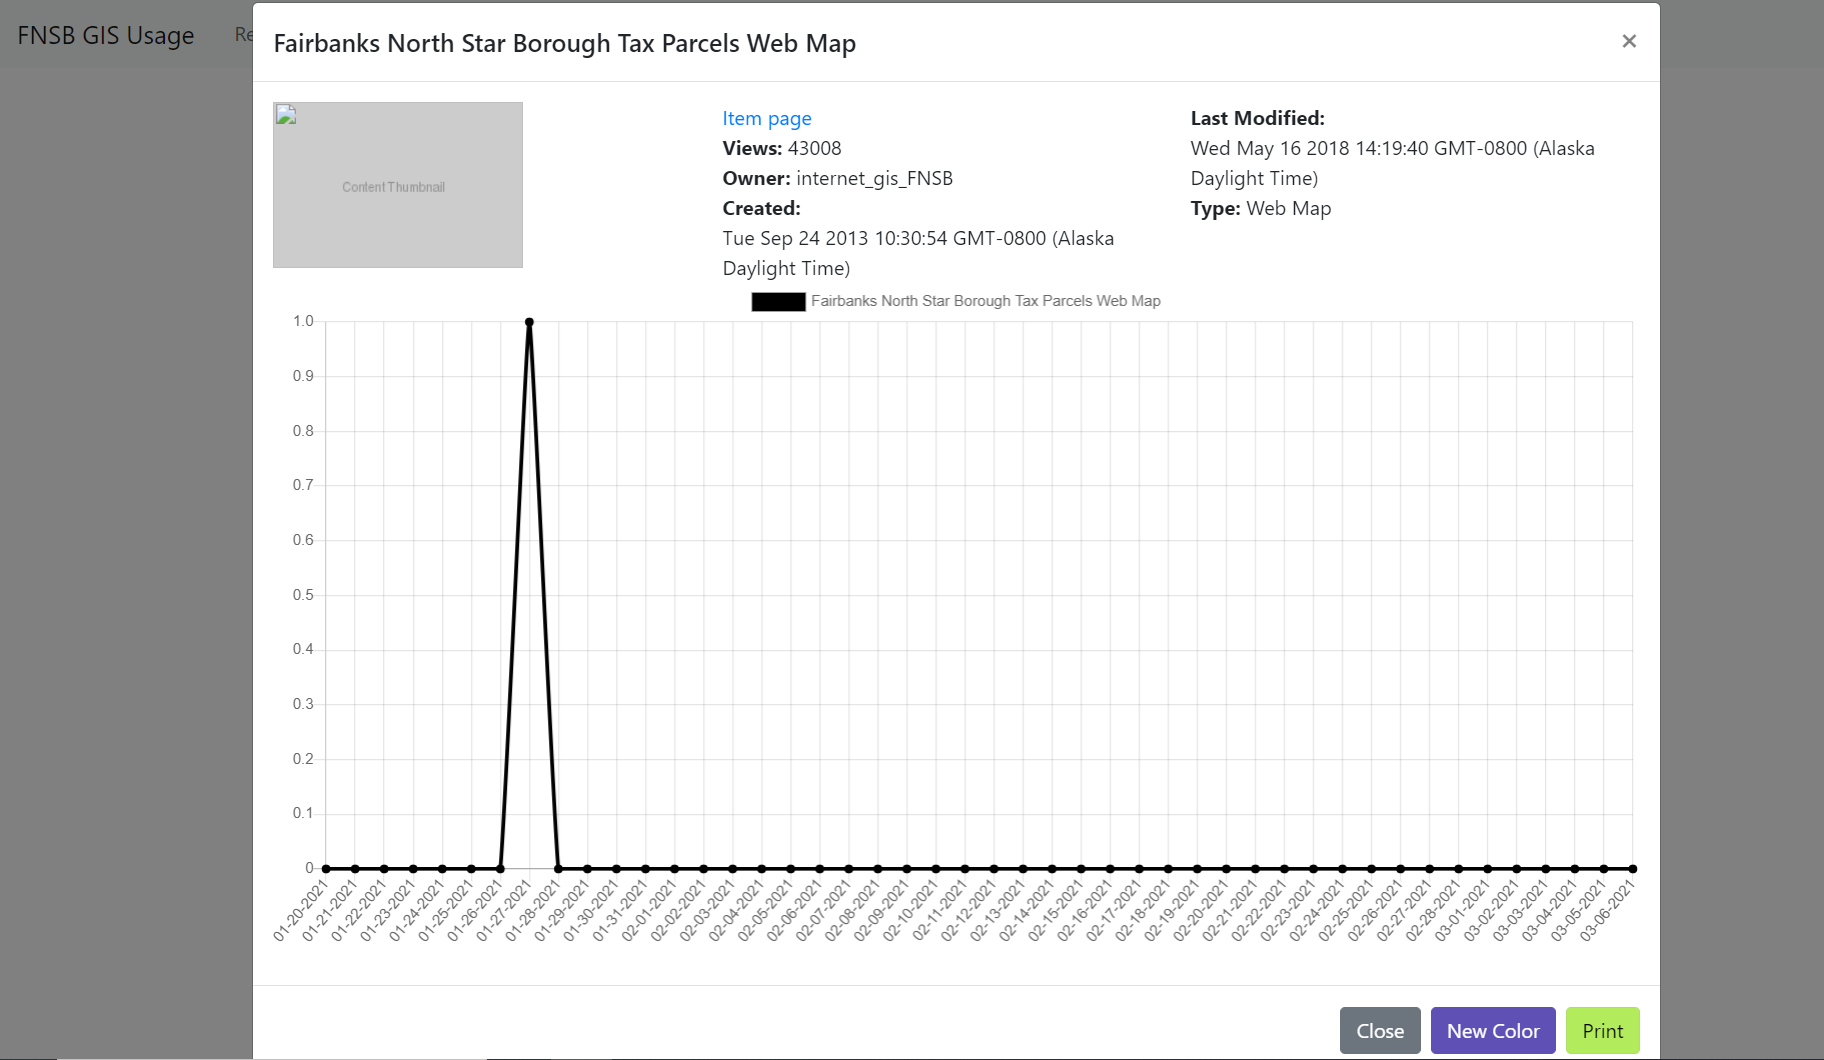
When clicking on a graph more information was drawn from ArcGIS Online, like who the owner was, what the thumbnail was, etc. It also made it possible to change the graph color for better visibility/printing (coloring was random).
While it wasn’t used immediately (our gis team was in the process of moving everything from on-premise Enterprise to ArcGIS Online) they were happy to have a way to view how utilized an item was, internally and externally. This would help them in the future to justify any gis expenses / growth.
Python Web GIS Javascript Esri Flask