FNSB Air Quality
14 Oct 2021 - | Author: Laurin
Purple Air. Have you heard of it? No it’s not the toxic gas from Mario, though the concept isn’t far off. It’s actually a company selling affordable air quality monitoring devices to consumers for citizen science. Our local government decided to purchase a few since it was cheaper and more reliable than the alternative devices of the past.
In response, our GIS team created a public facing web app using Esri’s Experience Builder to display these PurpleAir devices’ data overtime.
My role? Responsible for the data extraction and formatting, I scripted the process in Python. Inside these scripts I naturally had to work with the API’s of the state and PurpleAir to extract data. (The state because they were still maintaining devices in the area.) Then I calculated the AQI based off the EPA’s standards (weighted averages, aka nowcast values). These scripts run at different intervals to update the public of hazards like wildfire smoke in the summer and stove/vehicle fumes in the winter.
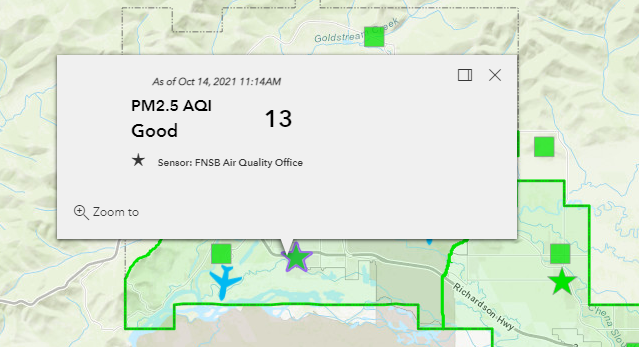
The stars represent borough-owned devices and the squares are devices owned by citizens.
Inserting interactable graphs, the ability to download data directly, and more detailed information on fnsb owned sensors remain future enhancements.
script python api air_quality webapp mobile arcgis esri